ブックタイトルFPCO English
- ページ
- 42/60
このページは FPCO English の電子ブックに掲載されている42ページの概要です。
秒後に電子ブックの対象ページへ移動します。
「ブックを開く」ボタンをクリックすると今すぐブックを開きます。
このページは FPCO English の電子ブックに掲載されている42ページの概要です。
秒後に電子ブックの対象ページへ移動します。
「ブックを開く」ボタンをクリックすると今すぐブックを開きます。


FPCO English
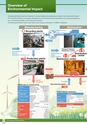
Overview ofEnvironmental ImpactCorporate activities involve the movement of various materials and substances and result in an environmental impact.FP Corporation strives to accurately understand the environmental load produced from its corporate activities soas to minimize the burden on the natural environment.The following flowcharts show mass balance and energy consumption in different segments.ManufacturingRecycling plantsCollected traysVenous distributionDistributionINPUTINPUTRaw materialsEnergySecondary materials, etc.Recycled materialsINPUTProduction plantsINPUTElectrical powerWaterOffice suppliesTransport betweendistribution centersDistribution centerDistributioncenterOUTPUTProductsOOUTPUTFY2013 data for manufacturingINPUTOUTPUTEnergyWater resourcesRaw materials(resins, etc.)Indirect materialsMiscellaneousProductsWasteEnvironmentalpollutantsWastePollutantsElectricity244,009,026 kWhFossil-fuel energy99,068,081 MJPublic water supply227,194 m 3Ground water149,508 m 3Industrial water133,807 m 3CardboardPlastic bagsLubricantsThinnersPaper158,887 t28,123 t2,393 t10,629 L45,598 L2,221,000 sheetsVolume of productsproduced151,788 tNumber of shippingtrucks121,548 vehicles11,840 tParticulates182 kgNOx7,065 kgDioxins1 mg-TEQBOD25,616 kgCOD35,286 kgSS5,706 kgArterial distributionProductsSubcontracted plantsINPUTFY2013 data for distributionINPUTOUTPUTEnergyElectricity 13,578,820 kWhFossil-fuel energy 3,429,537 MJWater resourcesPublic watersupply21,691 m 3MiscellaneousPaper13,611,350 sheetsWasteOUTPUT323 tWaste41 FP Corporation CSR Report 2014