Creating a comfortable dietary life through food tray containers
Financial Highlights
Sales
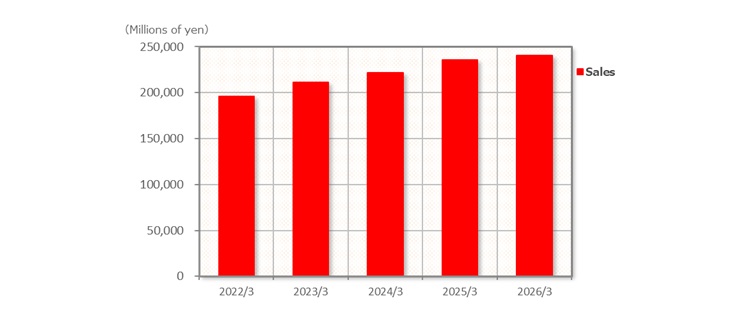
| March 2022 | March 2023 | March 2024 |
March 2025 |
March 2026 |
||
|
Sales (Millions of yen) |
195,700 | 211,285 | 222,100 | 235,628 | 240,490 | |
| Product sales | 151,770 | 166,060 | 171,653 | 180,770 | 184,503 | |
| Merchandise sales | 43,929 | 45,225 | 50,446 | 54,858 | 55,986 | |
Ordinary profit / Profit attributable to owners of parent
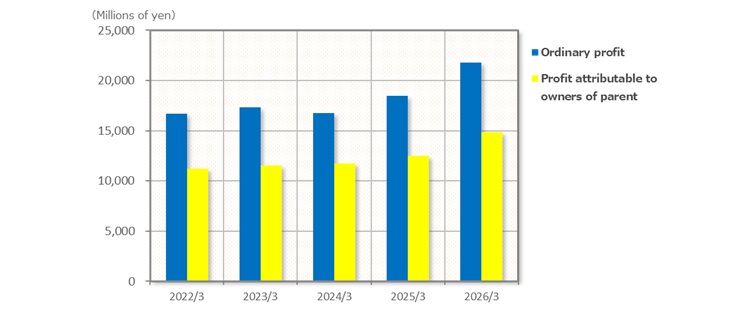
| March 2022 | March 2023 |
March 2024 |
March 2025 |
March 2026 |
||
| Ordinary profit (millions of yen) |
16,703 | 17,328 | 16,780 | 18,451 | 21,768 | |
| Profit attributable to owners of parent (millions of yen) |
11,206 | 11,529 | 11,724 | 12,486 | 14,869 | |
Net assets/Equity ratio
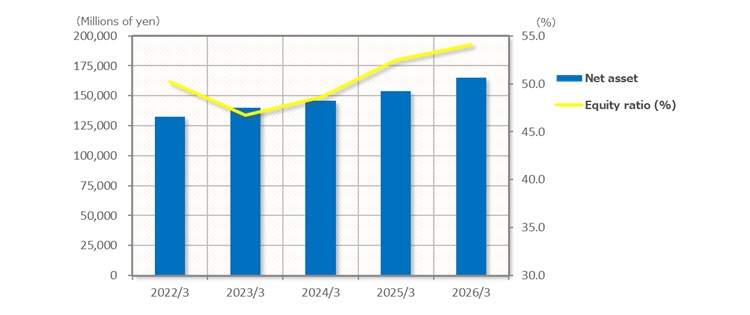
| March 2022 | March 2023 | March 2024 | March 2025 | March 2026 | ||
| Net asset (millions of yen) |
132,455 | 140,171 | 145,844 | 154,114 | 165,171 | |
| Equity ratio (%) | 50.2 | 46.7 | 48.6 | 52.5 | 54.1 | |
Cash flows
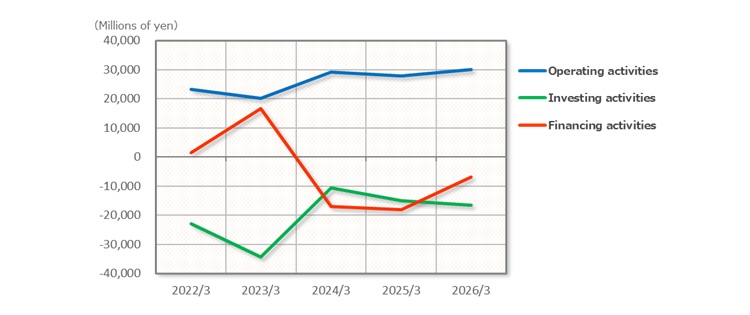
| March 2022 | March 2023 | March 2024 | March 2025 | March 2026 | ||
| Cash flow from operating activities | 23,148 | 20,071 | 29,176 | 27,919 | 29,981 | |
| Cash flow from investing activities | △22,866 | △34,306 | △10,711 | △14,929 | △16,594 | |
| Cash flow from financing activities | 1,578 | 16,745 | △17,013 | △18,070 | △6,928 | |